
The effect of catalyst on the rate of reaction
1.0 Introduction
What
is data logger?
A data
logger is an electronic device that records data over time or in relation to
location either with a build in instrument or sensor or via external
instruments and sensors. The data logger, but not entirely they are based on a
digital processor. They generally are small, battery powered, portable and
equipped with a microprocessor, internal memory for data storage and sensors.
Some data loggers interface with a personal computer and utilize software to
activate the data logger and view then analyze the collected data, while others
have a local interface device and can be used as a stand alone device.
Computer data logging
Computer
data logging is the process of recording events, with an automated computer
program. This process provides an audit trail that can be used to understand
the activity of the system and to diagnose problem. Due to the features of
practical activity for science is always by observation and measurement, with
the help of this process it can expose the student to a variety instrument that
can observe and measure. The results of observation and measurement are
presented in graph and table form after being processed. But now, with the
modern computer technology can now assist this process of handling data.
Computer data logging composed of several main parts such as sensor, interface
box and computer with appropriate software.
Sensor
is a device that responds to some physical property of the environment by
detecting the physical variation and converted into voltage signal and being recognized
by the interface box. The physical properties of the environment including the
temperature, pressure, light intensity, sound, position, magnetic flux,
voltage, current and others. The interface box is functioned to convert the
voltage signal of the sensor to a digital sensor, which is can be read by the
computer. The interface box very useful for data logging over extended periods
and contain own memory for data storing. Computer with appropriate software is
required so that the computer can interpret and process the signal from the
interface box. Other than that it manages to store, display and analysis data.
What are the advantages of using data
logger?
One
of the primary advantages of using data loggers is the ability to automatically
collect datas on a 24 hour basis. An experiment that conducted using data
logger can be repeated or stopped at any time as most of the work is taken over
by the data logger. Besides that, two experiments can be conducted
simultaneously. By this way, teacher can save time and helps the students to
overcome variety difficulties method and drawing graph manually. By using this
technology, students are also allowed to compare the results or graph with
other groups and pose the questions. This can increase the students
understanding about the subject. Less work needed to be done by the students.
Other than that, this computer-assisted data logging allows the students to
concentrate on scientific inquiry and development of problem solving skill.
This enable experiment to be done in a small group thus the learning process
becomes more meaningful. It encourages the students to do discussion on the
progress of the experiment and allow higher ordered thinking. Thus, by using
computer data logging, it increased interpreting skills enhances scientific
thinking, creativity and problem solving ability.
What are disadvantages of data
logging?
There
are still some disadvantages on the use of data logging in teaching and
learning. One of the disadvantages is data logging breaks down or malfunctions.
This is because some sensors are very sensitive to the highest voltage and the
students may not take precaution during handling this type of sensor and do not
starts use them at the lower voltage at initial. Due to this problem, some data
could be lost or not recorded. Other than that, the equipment can be expensive
for small task. This may caused the sensor provided in teaching and learning
are not enough in number and students need to share in large number of student
for one group and reduced an effective learning. The other disadvantages are,
the equipment will only take the readings at the data logging interval which
has been set up. If something unexpected happens, between recordings, the data
will not collected. The unexpected event could be like the sensor falls while
conducting experiment, electric power failure, etc.
What is catalyst and how it affects
the rate of reaction?
In
this experiment, the teacher has use data logger to conduct an experiment about
the effect of catalyst on the rate of reaction. The pressure sensor is used to
measure the production of oxygen gas produced. A catalyst can be defined as a
substance that increases the rate of a chemical reaction. Catalyst can speeds
up a chemical reaction but is not consumed by the reaction. In order for
chemical reactants to become products, the species involved in any reaction
must undergo a rearrangement of chemical bonds. If a reaction has a low rate,
that means the molecules combine at a slower speed than a reaction with a high
rate. In this experiment, hydrogen peroxide is used to react with the catalyst.
The higher the concentration enzyme catalase, the higher the amount of oxygen, released by the
destroyed hydrogen peroxides. This is because, the higher the enzyme catalase, the
higher rate of colliding collision between enzyme catalase and hydrogen
peroxide, more hydrogen peroxide being destroyed and released oxygen gas.
Oxygen is given off much faster if the hydrogen peroxide is concentrated than
if it is dilute.
2.0 Engage
Statement: You are given two different pictures
about the ways for student to their lecturer room which is located on the 6th
floor. Observe the picture carefully.
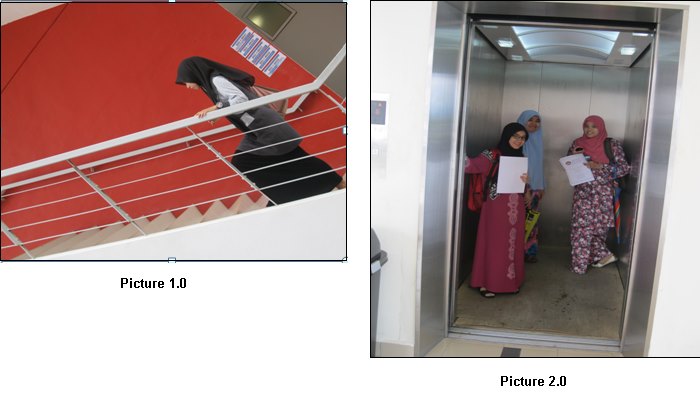
Question:
- What can you observe from the picture?
- Based on the picture, which one is faster? Give reason.
- What substance have similar representation with the elevator for this situation? And state its function .
- What if there are two elevators provided and what can you relate it with the time take for student to arrive to the 6th floor.
Answer:
- In picture 1.0, the student use the stairs to get to level 6 while in picture 2.0, those students, use an elevator to get to level 6.
- Based on these two ways, with an elevator will quickly get over with the stairs. This is because, lift provide an alternative pathway for the students to reach faster to get to level 6 compared by used the stairs.
- Catalyst. Substance that provides an alternative pathway to increase the rate of chemical reaction by lowering their activation energies. However catalyst does not cause a reaction to occur, it only increases the rate of the reaction that can occur even if the catalyst is absent.
- The two elevators will make the students arrive faster to the upper floor because when one of the elevator is being used, they can get into the other one.
3.0 Empower
A. Empower.
Steps:
1. Teacher explained today’s
experiment objective.
Objective:
- Use a computer and gas Pressure Sensor to measure the production of oxygen gas as hydrogen peroxide is destroyed by the enzyme catalase or peroxidase at various enzyme catalase concentrations.
- Measure and compare the initial rates of reaction for this enzyme when different concentrations of enzyme catalase react with H202.
- To study the relationship between H202 and enzyme catalase.
2.
Student
are given:
| FIGURE 1 |

- Computer enzyme suspension
- Four test tube
- Vernier O2 Gas Sensor
- Dropper
- Test tube rack
- Stopper
- Enzyme catalase
- 3% hydrogen peroxide
3.
Student needs to plan an experiment to determine the effect of catalyst on the
rate of reaction.
4.
Student has to construct a hypothesis for this experiment.
5.
Student should know the effect of catalyst on the rate of reaction.
6.
Teacher will help the student to determine the variable involved.
7.
Teacher may give these instructions to start the experiment by using data
logger.
Procedure:
1.
Connect
the Oxygen Gas Sensor to the computer interface. Prepare the computer for data
collection by opening the file “02 (O2) Enzyme” from the Advanced
Biology with Vernier
folder of LoggerPro.

2.
Click ‘Length’ menu .

3.Change the length to 180 s, then click
‘ok’

4.
Place
four test tubes in a rack and label them 1, 2, 3 and 4.

5.
Fill
each test tube with 3 ml of water and 3 ml of 3% of  .
.

6.
Connect
the plastic tubing of the pressure sensor with the gentle half turned.

7.
Initiate
the enzyme catalase reaction as follow:
a.
Placed
1 drop of enzyme catalase into test tube 1

b. Quickly stopper the
tube.

c.
Swirled the test tube gently

d. Connect the other
plastic tubing to the top of the stopper.

e. Then,
start the data collection. Continue to swirled 3 minutes of data collection.

f. Once, data collector is
finished, removed the stopper from the top of the test tube.

8.
To
determine the rate at which oxygen was produced, click analyze menu and choose
curve fit, and then click pressure.

9.
Fold
down fit equation menu and choose linear, then click ‘ok’.

10. The slope will represent the
rate at which oxygen was produced.
11. Repeat
the experiment with different enzyme catalase concentration with 2, 3 and 4
drops of enzyme catalase into test tube 2, 3 and 4 labeled test tubes.
12. After
completing the experiment, you can show all rums of experiment by choose ‘Run
4’ and then click ‘All runs’.
13. Compared all the graphs.

Results:
Question:
- Which type of catalyst that being used in this experiment?
- Which concentration of enzyme catalase having the highest rate of reaction?
- What type of gas being produced?
- Compare the four graphs and give reasons.
Answer:
- Positive catalyst. This is because a positive type of catalyst will increasethe rate of reaction.
- 4 drops of enzyme catalase.
- Oxygen gas.
- Based the four graphs, we can see that the graph for 4 drops of enzyme catalase is more slope followed by the 3 drops of enzymes catalase, 2 drops of enzymes and the last one is graph for 1 drop of enzyme catalase. From this results it shows that the higher concentration of enzyme catalase, the higher the pressure of oxygen gas being detected by the pressure sensor, the graph also more slope. In conclusion, the higher the concentration of enzyme catalase, the higher the production of oxygen gas
4.0 ENHANCE
Cloth 1


Cloth 2
Statement: There are clothes that dirty with
oily food residue. Which one is better to wash the cloth that dirty with oily
food residue either the larger amount of powder detergent or the small amount
of powder detergent? Explain.
Cloth 2 is clean better because it use
the larger amount of powder detergent to clean the cloth that dirty with oily
food residue. The increase amount of powder detergent would increase the rate
of reaction to occur. The cloth 1 is slow reaction occur because the small
amount of the powder detergent is use to clean a cloth. The detergent contains
protein enzymes that classified as proteases. These enzymes increase the
cleaning action of household detergent by accelerating the hydrolysis of oily
food residues, so that they could be more rapidly dispersed and emulsified in
water. The rate of reaction in hydrolysis of food residue is increase due the
larger amount of the detergent is use. The enzyme proteases are photolytic
enzymes that degraded protein by cleaving the peptide bonds, thus assisting in
the removal of protein-based stain such as blood and many types of food.
5.0
Conclusion
By
integrated the use of data logging in teaching and learning is very useful.
This is because it can help to develop logical understanding of the abstract
concept and at the same time they can obtain confirmation on the truthfulness
of the underlying process. Apart from that we can polish student thinking
skill, communication skill, be more creative and innovative, making decision
skill, etc. From all the skills stated, we can achieve the vision 2020 as the
student will be more creative and innovative to accomplish the development. The
students also able to think out of the box, as they can applied all the theory
practically and get clearer picture about the topic. From this method, it will
help them for not just aiming to excel in examination but also applied all the
theory they had learnt into daily life as to improve the quality of life.
6.0 References
1. Computer data logging.
Achieved on November 25, 2012 at
2. Data logger. Achieved on
November 25, 2012 at
3. Leonard R.N. Data logging in
the science classroom: Approaches to innovation.
4. Enzyme Action: Testing
Catalase Activity. Achieved on October 29, 2012 at
activity/
5. Enzyme action: Testing
catalase activity (method 1-  gas sensor). Achieved on November 1, 2012 at http://www2.vernier.com/sample_labs/BIO-A-02A-COMP-enzyme_action.pdf.
6. Factors affecting the
speed-rate of chemical reactions. Achieved on November 3,
7. P. Robert-Jan Simons.
Authentic learning and ICT. Achieved on November 12, 2012
8. Using ICT & data logging
for teaching and learning of science . Achieved on
No comments:
Post a Comment